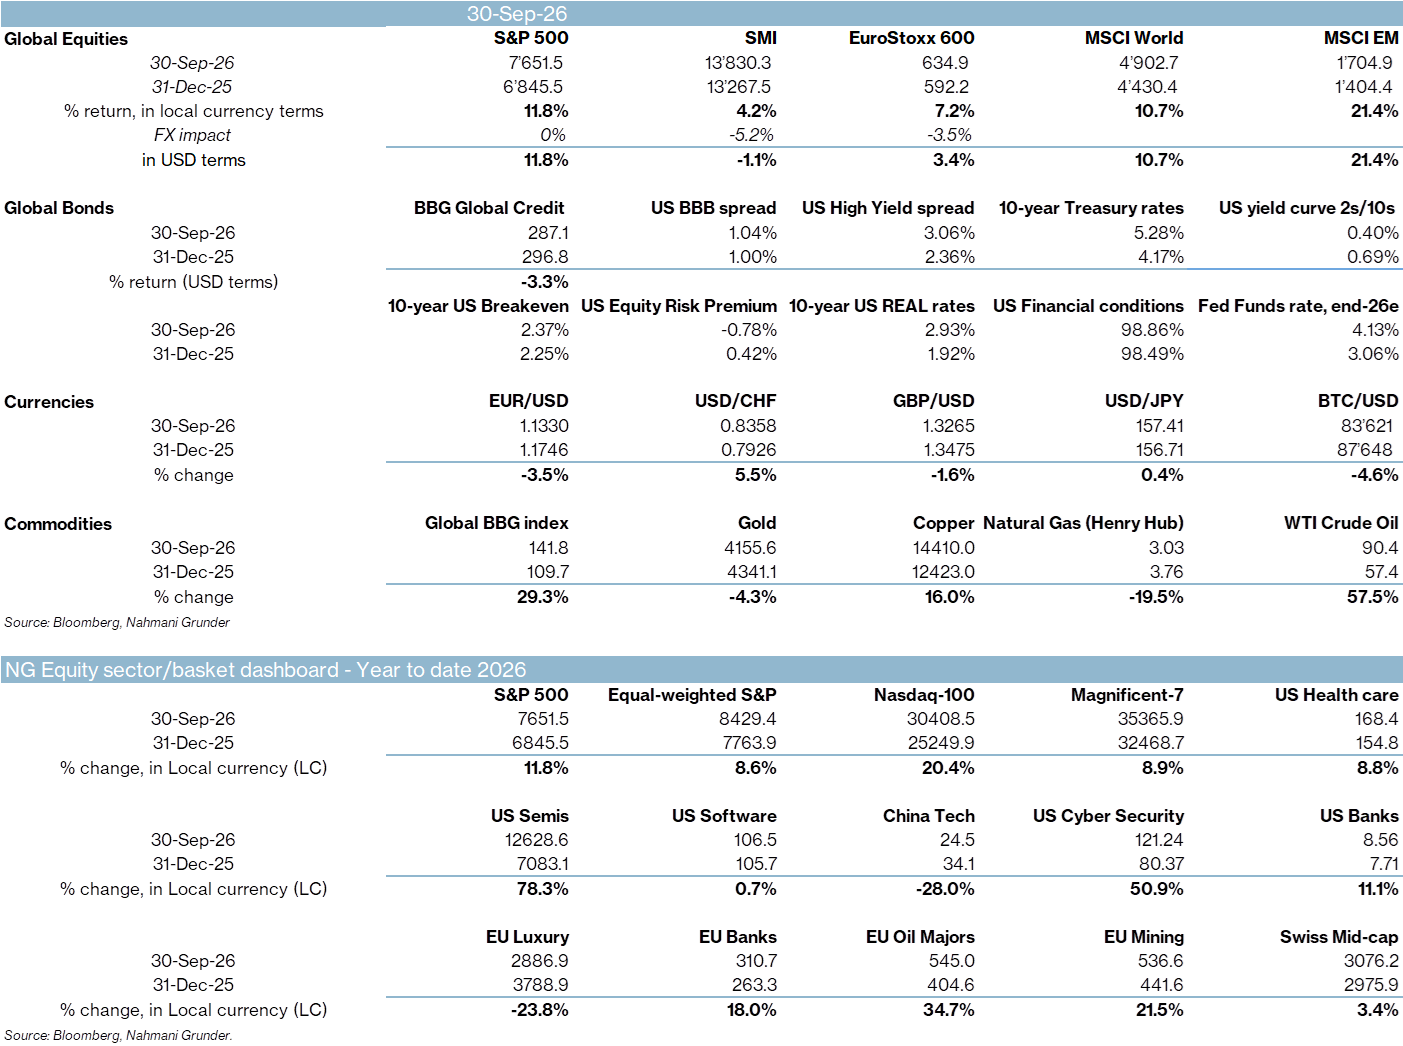
1. Bond markets remain under pressure.
The US 10-year Treasury yield has risen from 4.17% to 5.28% year-to-date, its highest level since summer 2007, and has risen for seven consecutive months. The 2-year yield has increased by approximately 145 bps (there is a trade here), and the 2s/10s curve has flattened from 0.69% to 0.40%. Market expectations for the end-2026 Fed Funds rate have moved from 3.06% to 4.13%. Global credit has returned -3.3% year-to-date.
2. Real yields, not inflation, are driving the move.
10-year real yields have risen by approximately 100 bps (1.92% to 2.93%), while 10-year breakeven inflation has barely moved (2.25% to 2.37%). Unlike in 2022, the sell-off does not reflect an inflation shock. Higher real yields nonetheless weigh on most asset classes, as gold's -4.3% year-to-date decline illustrates. The US equity risk premium has turned negative (-0.78%).
3. Equities have absorbed higher rates at the index level.
The S&P 500 has traded in a narrow range around 7,700 for two months and speculative investors have materially reduced their US equity exposure. The index is nonetheless up 11.8% year-to-date, and a typical one-week move would take it back to its all-time high. The Nasdaq-100 (+20.4%) reached a new high last week. MSCI World has gained 10.7% and MSCI Emerging Markets 21.4%.
4. Rate-sensitive segments have underperformed.
Measured from their recent highs, biotech has fallen 8%, small caps 9%, REITs 10%, homebuilders, and utilities 15% each, and unprofitable technology companies -19%. The equal-weighted S&P 500 (+8.6%) continues to lag the market-cap-weighted index something I felt was obvious given the high multiple on offer with limited future growth.
5. Earnings growth has offset valuation compression.
One year ago, the 10-year yield stood at 4.14% and the S&P 500 traded on approximately 23x forward earnings. Today, the yield is 5.27% and the multiple has compressed to approximately 19x. Over that period, the spread between the equity earnings yield and the 10-year yield has remained remarkably stable. The market has priced higher rates through lower valuations, while strong profit growth has supported prices. US mega-cap technology has continued to deliver thesis-affirming news, such as Meta's Muse and NVIDIA's substantial share buyback. Leadership has nonetheless narrowed: US semiconductors are up 78.3% year-to-date, while the Magnificent-7 (+8.9%) and US software (+0.7%) have lagged.
6. Regional and sector dispersion is significant.
In Europe, oil majors (+34.7%), mining (+21.5%) and banks (+18.0%) have outperformed, while luxury has fallen 23.8%. China technology is down 28.0%. Commodities have been strong, with the Bloomberg Commodity Index up 29.3%, WTI crude up 57.5% and copper up 16.0%; natural gas has fallen 19.5%.
7. Risks to monitor.
Historically, a rise of two standard deviations in 10-year yields within a month (approximately 50 bps in today's terms) has tended to pressure equities, particularly when real yields drive it. That threshold has recently been triggered. History also shows that the early stages of a tightening cycle are typically volatile, and liquidity withdrawal by the Federal Reserve, together with the US fiscal outlook, warrants caution. US high-yield spreads have widened from 2.36% to 3.06% but remain contained.
8. Historical perspective for the Tech Doomsdayers .
In 1999, the Federal Reserve began raising rates in late June and hiked twice more thereafter. From the first hike to year-end, 10-year yields rose from 5.78% to 6.44%, yet the Nasdaq-100 gained 61%, and it doubled from its October 1999 low to its March 2000 peak, the Tech world is different in many ways today but our clear message to take away on this front is that valuation discipline remains key.
9. Outlook.
Absent an inflation surge or signs of credit stress, we regard higher rates as a headwind for equities rather than a catalyst for a broader correction and expect earnings growth to remain healthy.